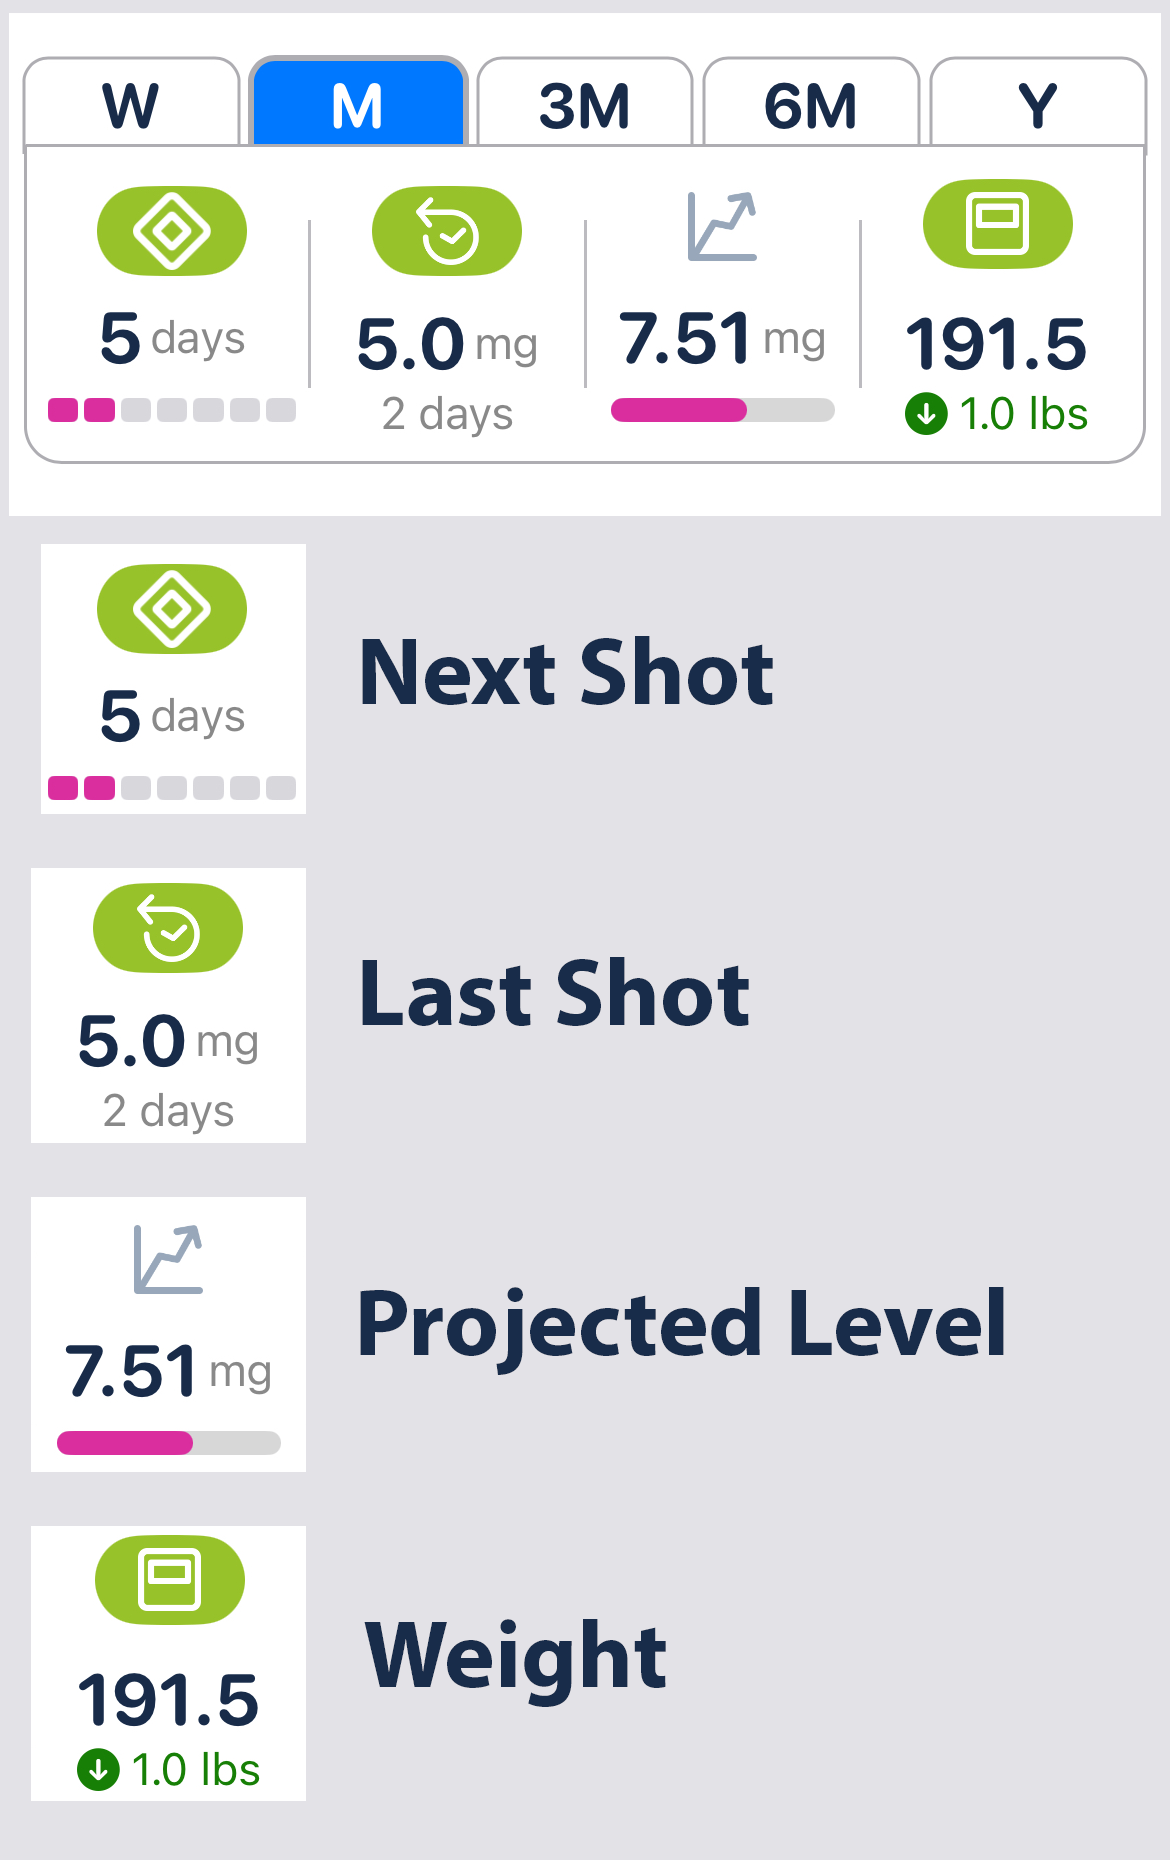
At the top, you’ll see the time-range tabs:
W (Week), M (Month), 3M (3 Months), 6M (6 Months), Y (Year)
These control the time frame shown on your chart. The selected range is centered on today—so you see both history and future projections.
For example: M shows about half a month of past data and half a month of projected future data.
Cards explained:
Next Shot – Shows when your next injection is due.
In this example: due in 5 days.
Tap for next shot details.
Last Shot – Displays the dosage and when it was last taken.
In this example: 5.0 mg taken 2 days ago.
Tap to open the Shot Scheduler.
Projected Level – Estimates the medication level currently in your body.
In this example: about 7.51 mg.
Weight – Shows your most recently recorded weight.
In this example: 191.5 lbs, down 1.0 lbs from the last entry.
Tap for weight and BMI details.
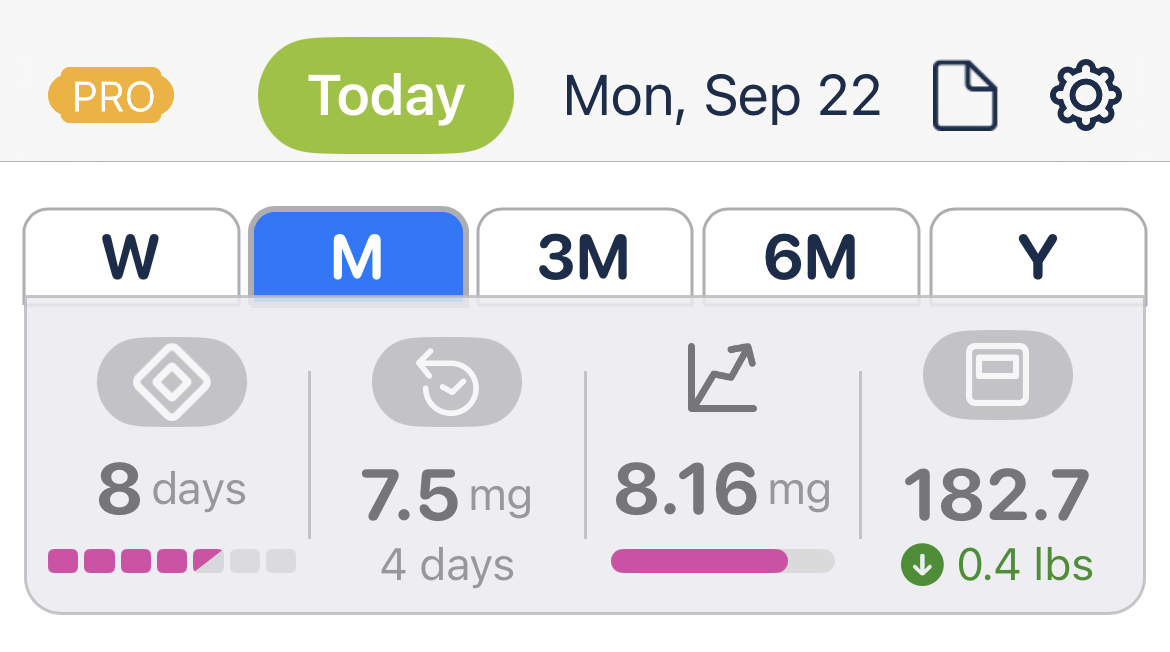
Next Shot – Shows when your next injection was scheduled at that time.
In this example (Aug 20): next shot due in 5 days.
Last Shot – Displays the dosage and when it was last taken.
Here: 5.0 mg taken 2 days earlier (Aug 18).
Projected Level – Estimated medication level in your body on the selected date.
Here: about 6.31 mg on Aug 20.
Weight – The most recently recorded weight as of that date.
Here: 192.5 lbs, down 0.1 lbs from the previous entry.